How C-Store Operators Can Master Price Perception, Outmaneuver Fast Food, and Turn Value into Foot Traffic, Loyalty, and Sales in 2026
When household budgets tighten, price rises straight to the top of your customer’s decision-making process. Every stop along the route gets a quick, quiet audit: Is this worth it? Could I get it cheaper somewhere else?
For decades, convenience stores operated on a tacit agreement with the shopper. We offered unmatched proximity, cold drinks, fast transactions, and a full tank of fuel. In exchange, customers accepted a modest premium, what many in retail call the “convenience tax.”
In late 2026, relying on that agreement is a risky bet. When shoppers feel financially squeezed, any store that seems indifferent to their budget gets crossed off the route. Drivers will pump fuel at your forecourt and drive away without buying an inside item. Worse, they may bypass your site entirely for dollar discounters, mass grocers, or fast-food drive-thrus running national loss leaders.
The Problem: Price Perception Is Broken, and Shoppers Notice
Price perception is the overall impression a shopper forms about whether your store is fair, expensive, or a bargain. It is built from a handful of visible prices, the look and feel of your building, and how easy it is to see value the moment someone walks in.
When that impression turns negative, the damage spreads well beyond one product. A customer who decides your store is “pricey” stops browsing the foodservice counter, skips the impulse endcaps, and keeps the fuel purchase as the only transaction. That is the forecourt-to-store gap, and it costs operators real profit every day.
The Opportunity: Convenience Stores Are Built to Win the Value Battle
Here is the encouraging part. Convenience stores are uniquely positioned to win this fight. Over 93% of Americans live within a ten-minute drive of a convenience store, and our transactions typically take under four minutes from entrance to exit.
Meanwhile, traditional quick-service restaurants (QSRs) have pushed combo meal pricing well above $10. That has created consumer backlash and left a wide opening for convenience prepared-food programs that deliver a hot, satisfying meal for much less.
I work on the design and equipment side of this industry: store layouts, custom cabinetry and counters, foodservice equipment placement, and in-store visual merchandising. That vantage point has taught me something operators sometimes overlook. Layout, millwork, lighting, signage, and equipment placement shape price perception just as powerfully as the numbers printed on a shelf tag.
A cluttered, dim, run-down interior makes customers assume prices are steep and food quality is questionable. A bright, organized store with clear, transparent value bundles tells them they have found an affordable and reliable stop.
What We Will Discuss in This Guide
This guide pulls together industry data, shopper behavior research, and field observations into a complete strategic playbook for 2026. It is organized into four section:
- The Foundational Landscape. Why the 2026 economic squeeze is hitting shoppers harder than headline inflation suggests, why saving customers money now outweighs quality in driving store choice, how Key Value Items (KVIs) shape price perception, and why managing to penny profit protects your balance sheet.
- Strategic and Operational Execution. How to build a Good-Better-Best private-label assortment, how store layout and casework reinforce quality perception, and how to close the gap between fuel traffic and inside sales.
- Innovation and Profit Maximization. How to use fresh foodservice against QSR value menus, capture Gen Z and Millennial beverage discovery, adapt to GLP-1 snacking habits, and put digital loyalty and retail media to work.
- The Executive Action Plan. A practical 30-day roadmap that sequences pricing fixes, foodservice launches, store and forecourt improvements, and community trust initiatives.
Managing price perception does not require slashing prices across your inventory or gutting your gross margin. It requires surgical, intentional execution. Let’s look at how to turn your store into a high-margin value destination.
The Foundational Landscape: Macro Pressures and the Psychology of Value
Why Is Headline Inflation Deceptive in 2026?
Headline inflation is deceptive because shoppers feel cumulative price increases, not the latest annual percentage. Reports may show annualized inflation settling between 2.6% and 3.0%, but consumers are living with the combined effect of several years of increases.
A family paying 25% to 30% more for essentials than a few years ago does not celebrate a 2.8% annual print. Wages have largely plateaued, credit card interest rates remain elevated, and an unexpected emergency expense can turn into a genuine crisis.
As a result, shoppers have become calculated budget managers. They watch every dollar, compare unit prices, and cut small daily luxuries that no longer justify their cost.
For convenience retailers, this changes the rules. In economic expansions, shoppers lean toward speed and brand indulgence. In 2026, the mindset has reversed into a flight to value, and shoppers reward retailers who help them stretch their household dollars.
The chain reaction looks like this: years of cumulative inflation shrink disposable income, which pushes shoppers into a flight-to-value mindset, which weakens loyalty across channels, which leaves shoppers choosing whoever saves them the most money.
The “Save Me Money” Shift: Why Price Now Outweighs Quality 5 to 1
Customer preference modeling shows how shopper psychology changes under stress. In normal economic conditions, saving customers money is roughly 1.5 times more influential than quality in driving retailer preference.
During sustained economic strain, that ratio jumps to roughly five times. Saving money becomes five times more influential than delivering high quality in driving retailer choice and market share.
That does not mean quality has stopped mattering. It means quality alone cannot rescue poor price perception. If you serve exceptional chicken tenders or fresh bean-to-cup coffee at an unchecked premium, customers will drive past.
When you establish a clear price-value proposition, shoppers reward you with steady foot traffic, bigger baskets, and long-term loyalty. The job is to prove, repeatedly and visibly, that you are on their side.
How Blurred Channels Changed the Competition
A decade ago, shoppers used distinct silos: grocery for weekly provisions, quick-service restaurants for lunch, and convenience stores for fuel, tobacco, and emergency beverage runs. Today those lines have largely disappeared.
Shoppers think in terms of solutions, not channels. They weigh proximity, speed, and perceived dollar value, then choose the option that wins on all three.
Consider a customer asking, “Where should I get breakfast?” Your counter is competing against a McDonald’s drive-thru, the Starbucks down the road, and the grab-and-go cooler at the local supermarket. Picture three options side by side: a drive-thru combo at around $11 with a seven-minute wait, a grocery wrap at around $7 plus parking hassle, and a c-store bundle at around $5 with a three-minute in-and-out visit.
Proximity gives you an immediate operational edge, but only if the price feels fair. If shoppers sense a 30% price penalty, they will use your fuel pump and buy lunch somewhere else.
What Are Key Value Items (KVIs), and Why Do They Matter?
Key Value Items are the small group of everyday products shoppers use to judge whether a store is affordable. Shoppers do not memorize 3,000 SKUs. Retail behavioral research shows they form their overall price impression from a mental index of roughly 15 to 25 items.
In convenience retail, KVIs are typically daily staples and high-velocity impulse purchases:
- Gallon and half-gallon whole milk
- Standard loaves of white and wheat bread
- A dozen Grade A eggs
- 20-ounce core carbonated soft drinks (Coca-Cola, Pepsi, Dr Pepper)
- 16-ounce core energy drinks (Monster, Red Bull, Celsius)
- Leading national-brand combustible tobacco and modern oral nicotine packs
Imagine a parent who stops in for an emergency gallon of milk and sees it priced at $5.49, while the nearby supermarket sells it for $3.79. That parent concludes everything in your store carries a steep markup. You might have the best-priced hoagies in town, but that one milk tag damages your credibility and sends the shopper away from the foodservice counter and the snack aisle.
The fix is to price core KVIs at parity, or within pennies, of the local discounters and mass grocers. That creates a halo effect where shoppers assume the rest of your inventory is fairly priced.
You then offset the tighter KVI margins with asymmetric margin harvesting in price-inelastic categories where shoppers rarely compare prices. Examples include proprietary grab-and-go snacks, specialty automotive fluids, over-the-counter health essentials, and custom dispensed beverages.
Why Penny Profit Matters More Than Margin Percentage
One of the most common traps in independent convenience management is steering the store by gross margin percentage rather than cash profit. Percentages do not pay wages, utilities, or equipment leases. Cash margin dollars do.
The two formulas are simple. Gross margin percentage equals (retail price minus wholesale cost) divided by retail price, times 100. Penny profit equals retail price minus wholesale cost.
Here is a salty snack example. A national brand bag sells for $5.00 with a wholesale cost of $3.75, which is a 25.0% gross margin and $1.25 of penny profit per unit. A high-tier private-label equivalent sells for $3.50 with a wholesale cost of $2.10, which is a 40.0% gross margin and $1.40 of penny profit per unit.
The shopper saves $1.50 at checkout, a 30% savings. You earn 15 percentage points more margin and an extra $0.15 in cash profit on every bag, while strengthening your reputation for value.
When you evaluate categories through penny profit instead of percentages, you often find room for aggressive, shopper-friendly price points that still strengthen the bottom line.
What You Should Be Doing: Build a Foundational Pricing Architecture
- Audit your top 20 KVIs weekly. Price-check milk, eggs, bread, 20-ounce carbonated soft drinks, core energy drinks, and top tobacco SKUs against competitors within a three-mile radius. Close the gaps against local grocers and mass discounters.
- Track penny profit by category. Build scorecards that show total gross margin dollars and cash contribution per unit, not just percentages.
- Create asymmetric margin buffers. For every KVI you bring to parity, find two adjacent impulse or distress-purchase items, such as phone chargers, premium jerky, or packaged pastries, where margin can move up 3% to 5% without hurting unit velocity.
- Eliminate price discrepancies. Make sure electronic shelf labels and printed tags match point-of-sale scanner data exactly. A mismatch at checkout erodes trust faster than a high base price.
Strategic and Operational Execution: Merchandising, Store Design, and Forecourt Conversion

How Does a Good-Better-Best Private-Label Strategy Work?
A Good-Better-Best assortment gives shoppers three clear price-and-quality steps within a category. It builds price credibility without turning your store into an unbranded discount warehouse.
Shopper attitudes toward private brands have shifted dramatically. Industry research indicates that roughly 80% of U.S. consumers now rate private-brand quality as equal to or better than national brands. Store brands are no longer seen as generic trade-offs. Many shoppers see them as a smart personal spending decision.
The tiers work like this:
- Good (economy tier): Entry-level essentials, basic proprietary water, and bulk candy priced 25% to 35% below the national brand anchor, with typical margins of 38% to 42%. This tier keeps budget-stressed shoppers from walking out empty-handed.
- Better (core volume tier): Premium store brands and national-brand equivalents priced 8% to 15% below the anchor, with typical margins of 40% to 46%. This is the volume engine and the biggest source of category penny profit.
- Best (premium tier): Organic, artisanal, functional, or locally sourced specialties priced 10% to 25% above the category average, with typical margins of 45% to 52%. This tier serves affluent shoppers and trade-up impulse buyers.
The sweet spot for store brands is 8% to 15% below the national brand. If the gap is narrower than about 5%, shoppers tend to stick with the familiar label. If it stretches past 20% to 25%, shoppers start to suspect inferior ingredients or poor manufacturing.
Placing your high-tier private brand at eye level, right beside the national brand, makes the savings obvious and the choice easy.
What You Should Be Doing: Reset Your Assortment
- Reset center-store gondolas with Good-Better-Best spacing. Put high-tier private-label SKUs at eye level, priced 8% to 15% below national brand anchors.
- Reserve lower shelves for economy basics and top shelves for premium functional lines.
- Merchandise side by side. Keep private label next to the national brand it replaces so the price gap is visible without any explanation.
- Review each tier by penny profit, not margin percentage, at least quarterly.
How Does Store Design Influence Price Perception?
Price perception begins before a customer reads a single price tag. It is shaped by store aesthetics, fixture design, lighting temperature, and sightlines.
Walk into a store with dim fluorescent tubes, cluttered wire racks, hand-scrawled cardboard signs, and chipped laminate counters, and the brain registers two quick warnings: this food may not be fresh, and these owners may be gouging me. Neglected spaces project desperation.
A well-lit store with clean lines, durable solid-surface or quartz countertops, modern wood-grain finishes, and integrated graphic headers signals operational discipline and quality. The first environment tends to trigger mistrust and lost foot traffic. The second tends to trigger confidence, longer browsing time, larger baskets, and repeat visits.
Three design elements do most of the work:
- Clear sightlines to fresh destination zones. When customers enter, their line of sight should land on a bright beverage bar or prepared-food counter. Low-profile center-store gondolas, 54 inches or lower, let shoppers see across the whole floor, which makes the store feel navigable and organized.
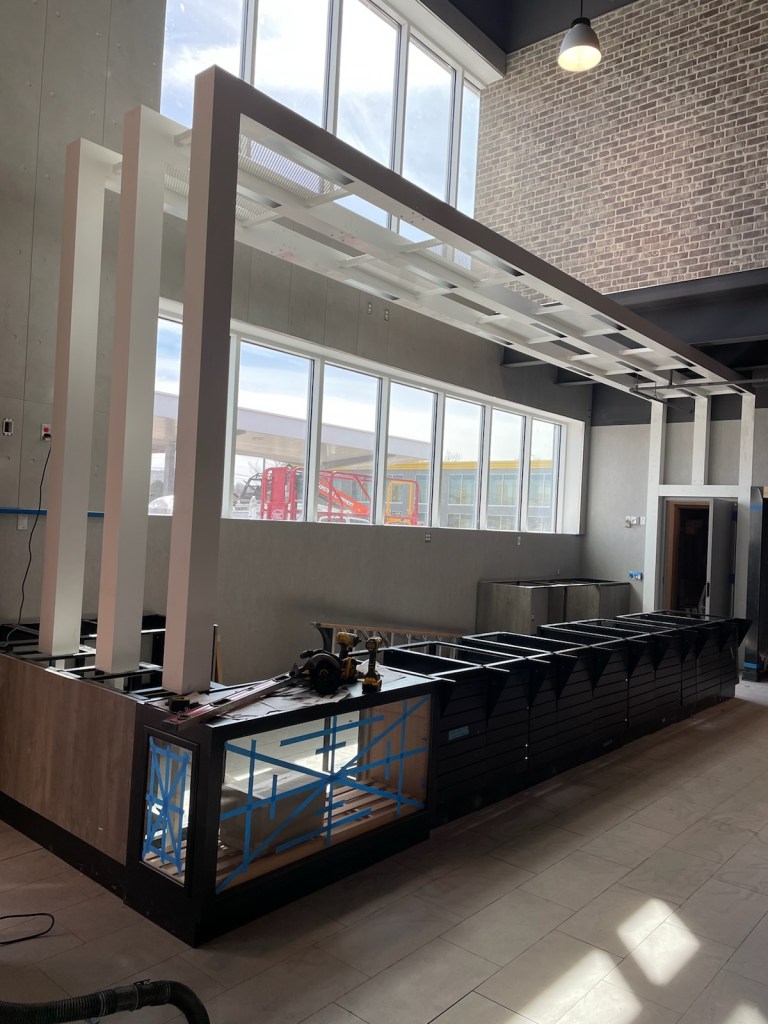
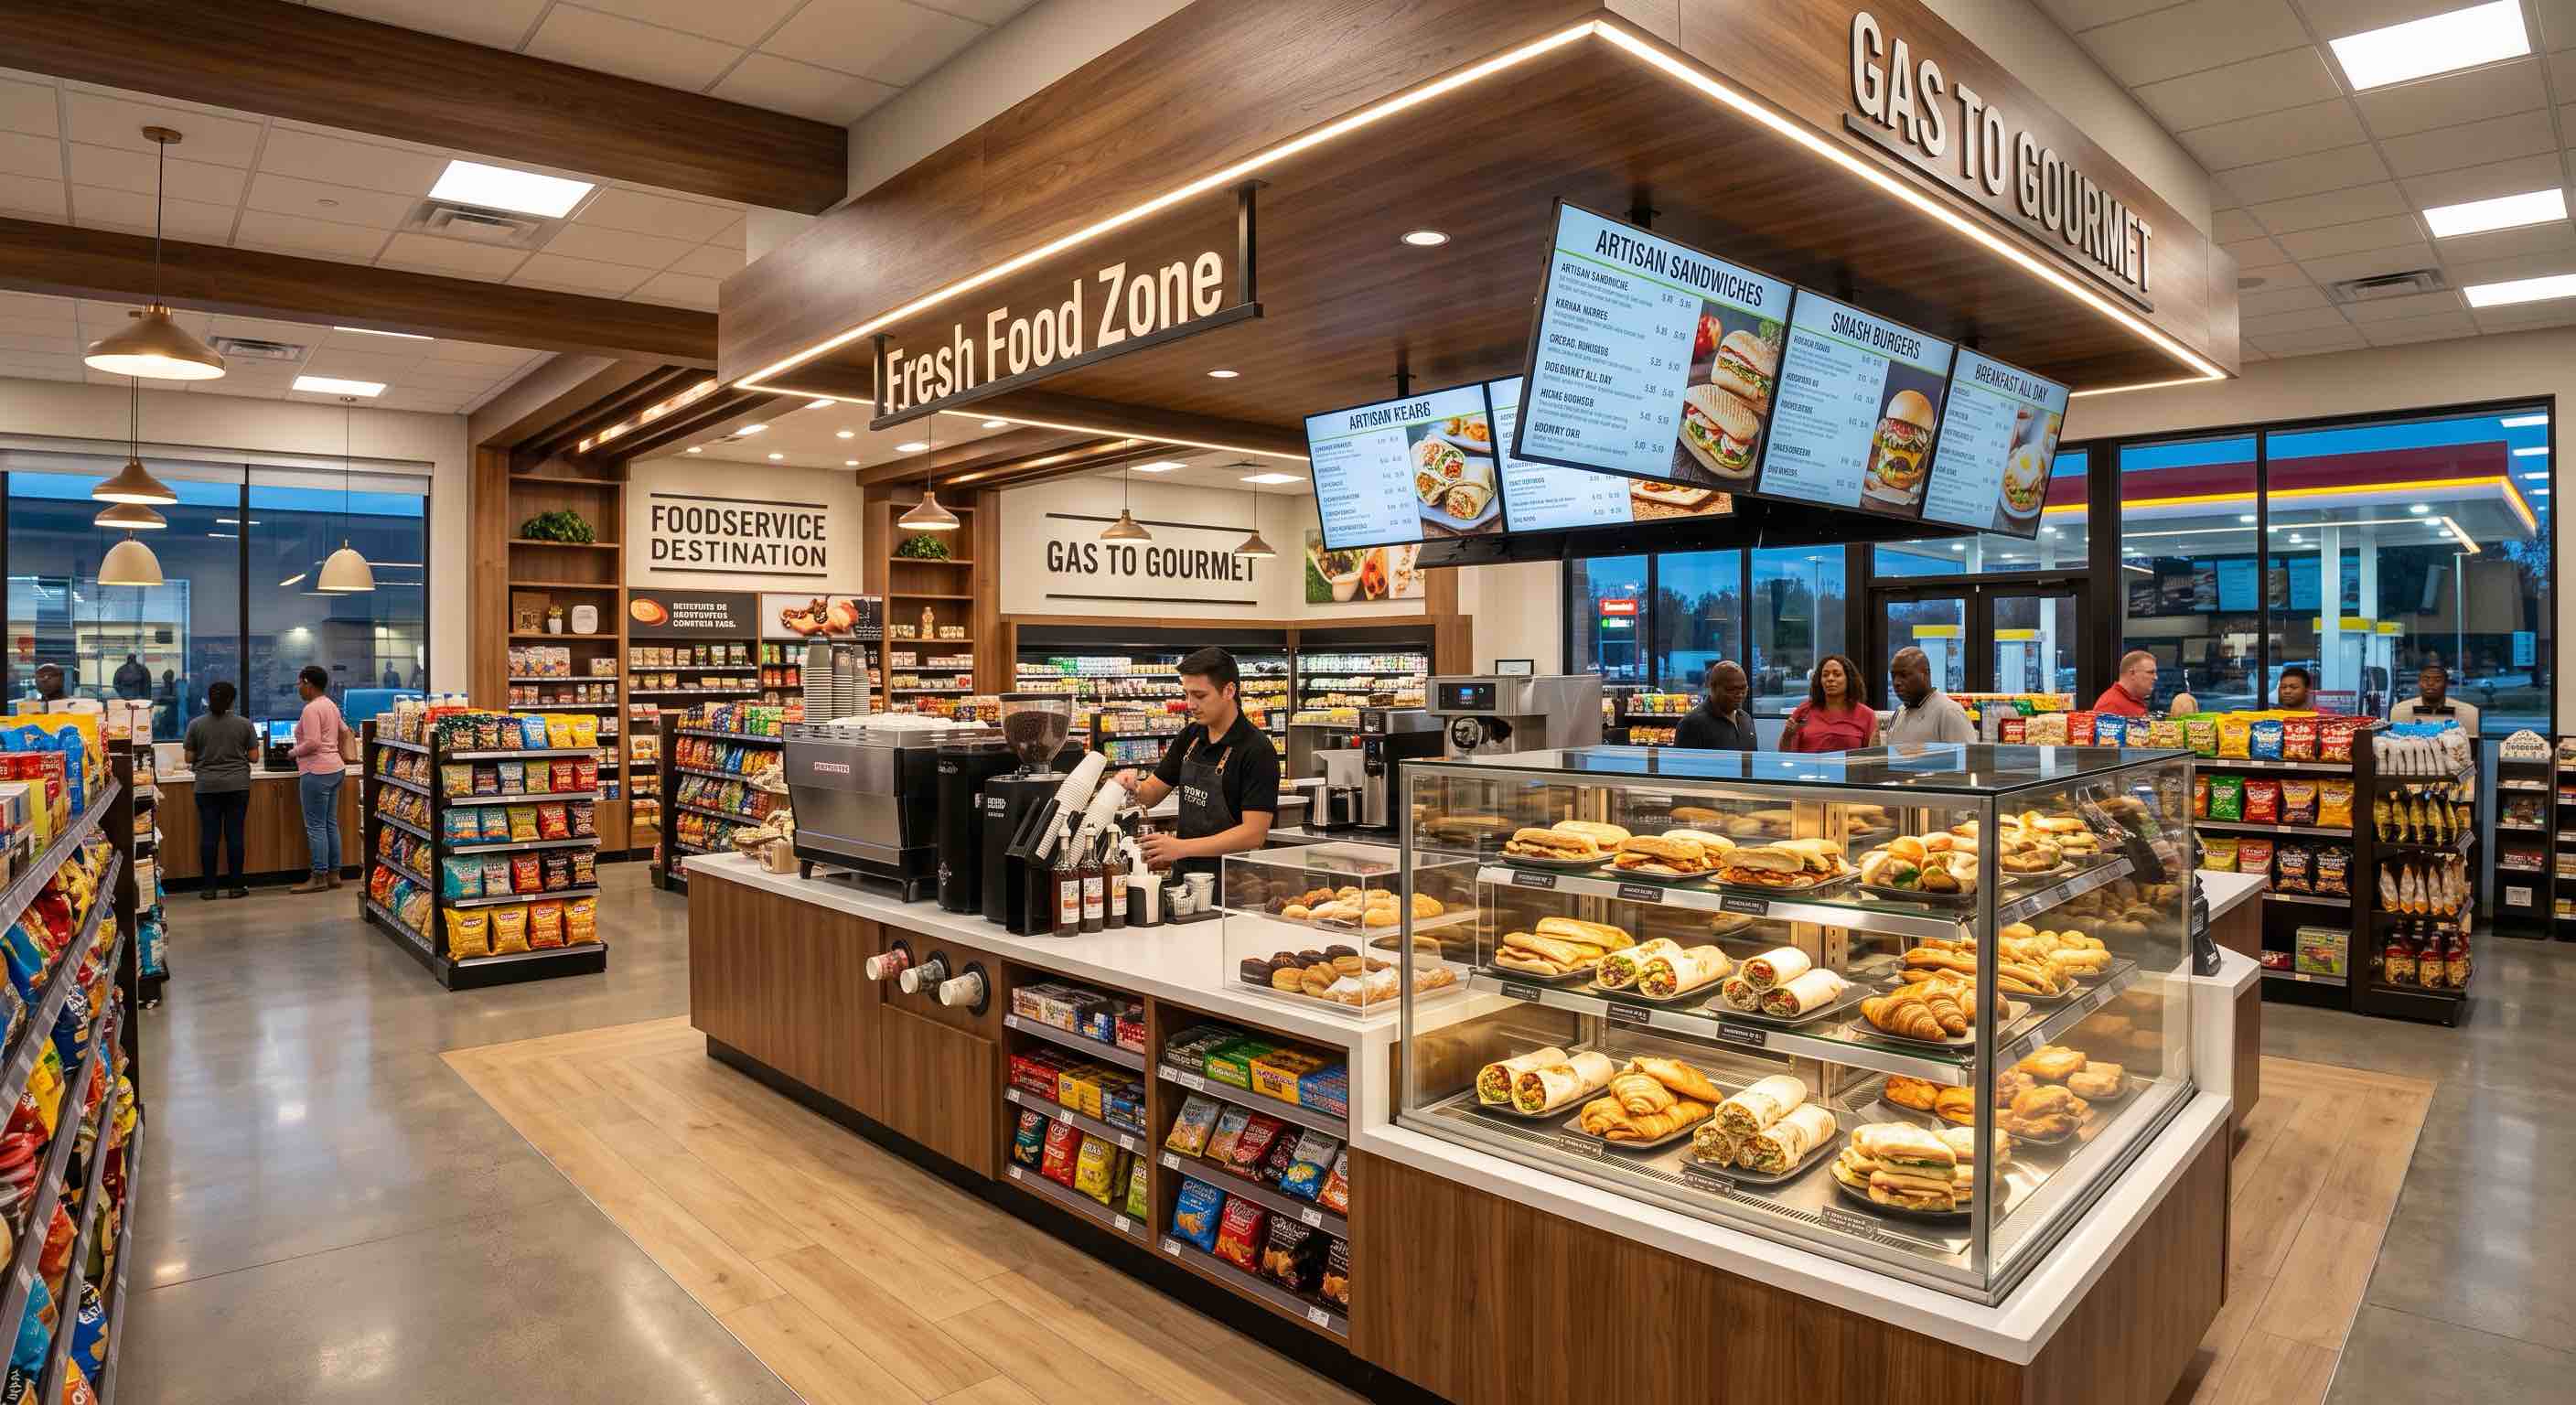
- Integrated millwork for equipment. Freestanding equipment scattered across the floor looks chaotic. Custom cabinetry that recesses bean-to-cup brewers, dispensed beverage units, and roller grills creates a fast-casual look instead of a gas station corner.
- 5000K high-CRI lighting. Color temperature affects product appeal. High Color Rendering Index (CRI) 5000K LED under-shelf lighting in grab-and-go cases and beverage stations makes fresh food look vibrant. Dark shelves hide product, and bright shelves invite purchase.
What You Should Be Doing: Upgrade the Store Environment
- Declutter the glass facade. Remove paper flyers, outdated vendor posters, and handwritten tape notes from the entrance glass so shoppers can see from the pumps into your fresh-food or beverage area.
- Audit counters and fixtures. Replace scratched or damaged laminate on checkout and coffee counters with durable solid-surface materials. Built-in trash receptacles, integrated napkin dispensers, and hidden condiment wells keep counters tidy during rush periods.
- Lower your sightlines. Where possible, move to gondolas 54 inches or lower in the main traffic path.
- Upgrade lighting in grab-and-go cases, beverage stations, and under the canopy to bright, high-CRI 5000K LEDs.

What Is the Forecourt-to-Store Profit Gap?
The forecourt-to-store gap is the difference between how many drivers buy fuel and how many walk inside. It is one of the largest unrealized revenue opportunities in convenience retail.
NACS and financial industry research paint a clear picture. Fuel accounts for roughly 65.0% of total convenience store sales dollars, while inside merchandise and foodservice make up about 35.0%. Profit tells a different story: fuel delivers only about 38.8% of gross profit dollars, while inside sales generate about 61.2%.
Fuel is a high-volume, low-margin traffic driver. Gross fuel margins have averaged around 40 cents per gallon, and electronic payment swipe fees, which reached a record $21.3 billion nationwide, consume roughly 10 to 15 cents of that. After site maintenance, insurance, depreciation, and compliance, net fuel profit often shrinks to pennies per gallon. Inside categories such as prepared food, fountain drinks, and snacks, by contrast, generate margins from 30% to more than 70%.
Yet more than 50% of forecourt patrons pump and leave without ever entering the store. Converting even 5% to 10% more of those drivers into inside shoppers can meaningfully change store profitability.
How Do You Get Fuel Customers to Walk Inside?
You interrupt their routine with a relevant, time-sensitive reason to step inside. Four tactics work well:
- Dynamic dispenser displays. Static pump toppers blend into the background. Cloud-connected LCD screens turn an idle three-minute fueling wait into a selling window with daypart-specific offers, such as a hot breakfast sandwich bundle in the morning or a cold beverage special in the afternoon. Operators typically see a 12% to 18% lift in the velocity of featured food and beverage items. The investment is moderate, with cloud-managed media.
- Geofenced mobile promotions. If you have a loyalty app or work with a mobile marketplace network, you can trigger a push notification when a customer pulls up to the pump. An offer such as “Claim 15 cents off per gallon today when you pick up any dispensed beverage inside” ties fuel savings to a high-margin inside visit. Data suggests targeted digital cross-promotions can increase pump-to-store conversion by up to 60%, with an average of $2.30 in incremental prepared-food revenue per transaction. The cost is mostly software configuration.
- Clear front-window visibility. A driver at pump four should be able to look through clean glass and see an inviting interior. Dozens of faded flyers block the view. Keep the glass clear, the sidewalks power-washed, and the entrance brightly lit. This costs nothing but staff discipline.
- Fast checkout. Self-checkout units near the front door reduce line anxiety. Operators report a roughly 25% drop in transaction abandonment and visits under 90 seconds. This requires moderate capital and point-of-sale integration.
What You Should Be Doing: Convert the Fuel Driver
- Program daypart-specific dispenser content featuring your breakfast and lunch value bundles.
- Test a geofenced offer that links a fuel discount to an inside purchase of a dispensed beverage or hot food item.
- Run a daily forecourt cleanliness routine. Power-wash pump islands weekly, wipe down dispenser surfaces daily, empty trash bins before they reach 75% capacity, and replace failing canopy lighting with bright 5000K LED fixtures.
- Track pump-to-store conversion weekly so you can see whether changes are working.
Innovation and Profit Maximization: Foodservice, Beverage Experiences, and Category Trends
Can Convenience Foodservice Really Compete with Fast-Food Value Menus?
Yes, and the numbers show why. Fresh foodservice has become the growth and margin engine of the modern convenience store.
NACS State of the Industry data shows foodservice generates about 28.5% of total inside sales but delivers about 38.9% of inside gross profit dollars. Among top-decile performers, foodservice drives upward of 46.6% of store gross profit dollars. Prepared food, including pizza, tenders, wraps, breakfast sandwiches, and bowls, accounts for about 73.9% of all convenience foodservice volume.
Convenience stores also hold clear advantages over QSRs:
- Speed. A typical convenience store transaction takes under four minutes, compared with roughly seven minutes in a fast-food drive-thru lane.
- Shifting perception. About 72% of consumers now consider convenience stores a legitimate alternative to fast food, up from 56% a year earlier. Around 43% rate c-store food quality equal to restaurants, and 11% rate it superior.
- Price. Quick-service chicken sandwiches average about $9.11, versus about $4.90 at convenience retailers, a gap of $4.21 (46% lower). Whole cheese or pepperoni pizzas average about $13.11 at fast-food restaurants, versus about $6.63 at convenience stores, a gap of $6.48 (49% lower). Breakfast combos run about $4.00 to $5.00 at convenience stores versus $8.50 to $10.50 at QSRs, roughly 50% lower.
When budgets are tight, a gap of 45% or more for comparable hot food is a powerful incentive. More than 62% of consumers say made-to-order convenience store food offers superior value, and 40% of those shoppers report cutting back on fast-food visits in favor of c-store programs.
How Do You Engineer a Profitable Tiered Meal Deal?
The key is blended margin. Rather than pricing every item a la carte, you bundle a hot entree with a low-cost side and a high-margin dispensed beverage. Independent and mid-sized operators can build tiered value meals at $3, $4, and $5 price points this way.
Datassential tracking indicates bundled meal deals drive about 17% of total store impulse purchases, with limited-time offers adding another 9% lift. The question is how to sell a full meal for $5 and still protect profit.
The answer is beverages. Self-serve fountain drinks and brewed coffee carry gross margins between 60% and 75%, with cost of goods sold (COGS) around 10% to 15%. They become the financial anchor of the bundle.
Here is an illustrative build:
- Hot entree (sandwich or tenders): COGS of roughly 38% to 42%
- Proprietary side (chips or hash brown): COGS of roughly 18% to 22%
- Dispensed beverage (fountain or drip): COGS of roughly 10% to 14%
Depending on your mix and recipe costs, the blended COGS on a $5.00 combo lands near 28%. That means a gross margin around 72% and roughly $3.60 in cash penny profit, while the shopper pays about half of what a fast-food combo costs. Run your own recipe costs before you set prices, because your numbers will differ.
What You Should Be Doing: Launch a Value Meal Program
- Launch a $4 and a $5 combo. Pair a core hot entree, such as a breakfast croissant or chicken tenders, with a private-label side and any fountain drink or bean-to-cup coffee.
- Target a blended gross margin of 70% or higher by leaning on dispensed beverages.
- Place self-service ordering kiosks at the fresh food counter if volume supports it. Kiosks ease peak rushes, improve upselling on sides and drinks, and make customization simple for younger guests.
- Review combo performance weekly and adjust the entree or side if food cost drifts.
Why Is Beverage the Discovery Category for Gen Z and Millennials?
Younger shoppers treat the convenience store as a refreshment destination. They want drinks that are customizable, shareable, and functional, and they see them as affordable daily treats.
Several platforms are growing quickly:
- Prebiotic and functional drinks. Away-from-home sales of adaptogenic beverages have grown by 32%, and prebiotic sodas have surged 53%. These items carry $2.99 to $3.99 price points and healthy margins.
- Cold coffee and matcha. Cold brew programs have expanded about 20% year over year, and iced matcha drinks have climbed between 69% and 117%. Countertop draft dispensers let operators serve iced matcha lattes and nitro cold brew at around $4.49 with COGS under 25%.
- “Dirty soda” and flavor add-in stations. Inspired by viral social trends, these concepts let shoppers customize a base soft drink with coconut cream, fruit purees, and flavored syrups. A standard $1.49 fountain drink becomes a customized $3.29 beverage, adding $1.80 in revenue per cup and pushing gross margin above 75%.
The physical setup matters here. Dedicated syrup rails, integrated nugget ice dispensers, and cold-foam stations built into the fountain counter make customization fast, which keeps lines moving during rush periods.
Pairing a $3.49 customized beverage with a value-priced breakfast sandwich gives younger shoppers a satisfying order while protecting your register ring.
What You Should Be Doing: Reconfigure the Beverage Island
- Add customization tools. Utilize PanelRak to install syrup pumps. Install flavor-infusion nozzles, nugget ice, and fruit purees at the fountain island.
- Price add-ins at $0.50 to $1.00 to generate incremental cash profit on every fountain run.
- Feature two signature recipes on clear counter graphics so shoppers know where to start.
- Test one functional or cold-coffee item at a premium price point and track velocity for 30 days.

How Are GLP-1 Medications Changing Convenience Snacking?
Between 12% and 20% of U.S. adults are currently using GLP-1 receptor agonist medications for weight management or metabolic health. These therapies reduce appetite and overall meal volume, which is reshaping impulse snacking.
Consumer tracking shows 61% of active GLP-1 users buy fewer sweet confections, and 56% buy fewer standard salty snacks. That sounds like a threat, but it is also an opening. Research indicates GLP-1 users are five times more likely to visit convenience stores than non-users.
The reason is the “power of one.” These shoppers avoid large, multi-serving grocery packs in favor of the single-serve, portion-controlled packaging that convenience stores already carry.
To serve the “protein commuter,” operators are rethinking endcaps and grab-and-go cases:
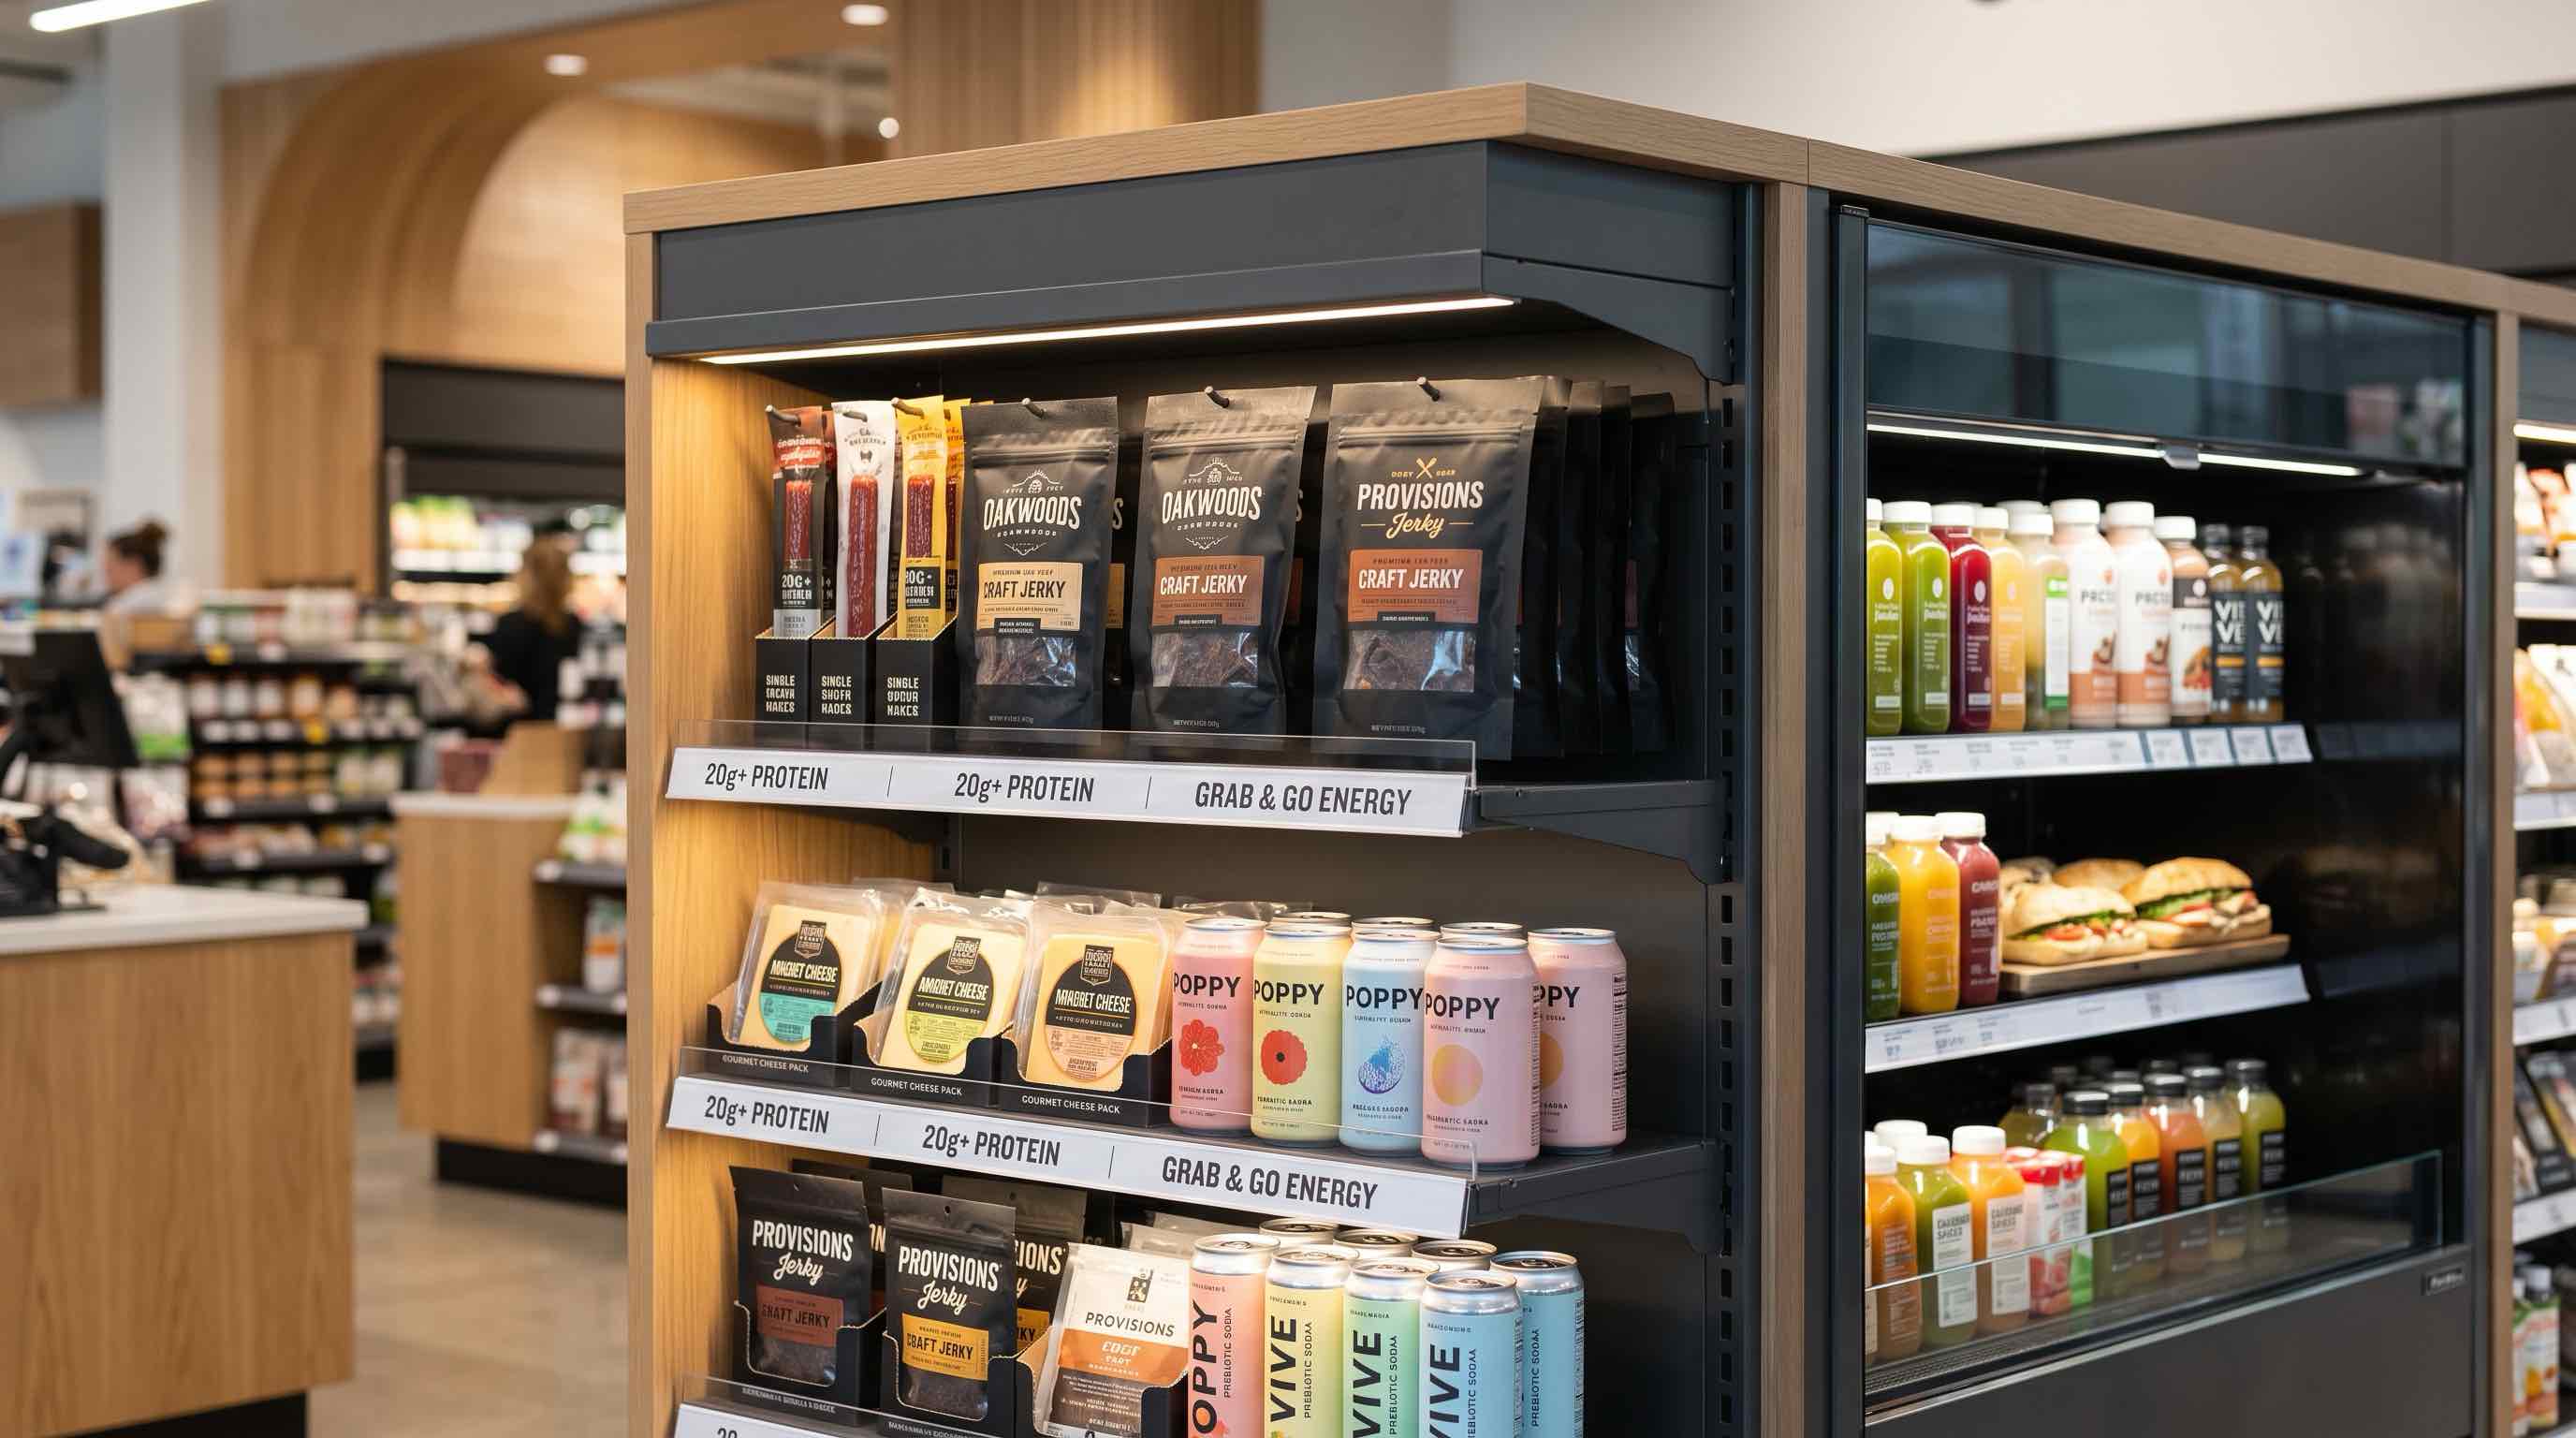
- Protein-forward assortment. Meat sticks, biltong, jerky, and artisan nuts posted a 7.9% sales increase in NACS State of the Industry data, driven largely by this demographic.
- Fresh protein packs. Swap oversized, carb-heavy meals for mini boxes with hard-boiled eggs, cheese curds, almonds, and sliced roasted turkey.
- Nutritional signage. Clean shelf strips reading “20g+ Protein,” “High Fiber,” or “Under 350 Calories” help shoppers decide fast and support healthy price points.
What You Should Be Doing: Merchandise for the Protein Commuter
- Build one “Power and Protein” endcap that consolidates meat sticks, protein cookies, Greek yogurts, and hard-boiled egg packs in a high-traffic spot.
- Use bold shelf tags that call out protein grams, fiber, or calories.
- Offer single-serve options in every major snack category.
- Create a protein grab-and-go box at a price point under $5.
How Do Digital Loyalty and Retail Media Support Value?
Gen Z and Millennials are digital-first. Research shows 91% of Millennials and 87% of Gen Z shoppers look for bundled meal promotions, but they rarely clip paper coupons. They expect deals to live inside an app.
Customer engagement platforms now let independents and regional chains launch branded apps with tiered rewards, mobile ordering, and personalized discounts without an enterprise-scale software budget. App-engaged loyalty members visit convenience stores about 2.6 times more often and spend about 2.8 times more per visit than non-loyalty shoppers.
Retail media networks (RMNs) are expanding at the same time. Large chains such as Circle K operate proprietary platforms reaching more than 6,600 locations. Independent operators can partner with turn-key digital media networks to monetize screens at the pump, coffee island, and checkout.
Consumer packaged goods brands co-fund discounts and limited-time deals shown on those screens. That vendor support lets you show shoppers real savings while preserving your base margin.
What You Should Be Doing: Put Digital Tools to Work
- Offer deals inside an app or loyalty program rather than on paper coupons.
- Tie fuel rewards to inside purchases so the savings feel connected.
- Explore vendor-funded promotions through a turn-key retail media partner, starting with one screen at the pump or coffee island.
- Measure basket size and visit frequency for app members versus non-members.
The Executive Action Plan: Your 30-Day Turnaround Roadmap
Improving price perception, raising visual standards, and strengthening category margins takes structured execution. You do not need to overhaul the business in a weekend. The roadmap below sequences the work so each week builds on the last.
The four weeks at a glance:
- Week 1: Assortment and KVI realignment. Price checks, margin harvesting, and shelf-tag updates.
- Week 2: Foodservice bundling and beverage reconfiguration. Launch $4 and $5 meals and set up flavor stations.
- Week 3: Store environment and forecourt activation. Declutter windows, program pump screens, and upgrade lighting.
- Week 4: Community goodwill and digital execution. Launch a register round-up, highlight local sourcing, and push app offers.
Week 1: Assortment and KVI Pricing Realignment
The first seven days focus on auditing base pricing and fixing your most visible value anchors.
- Days 1 to 2: Competitor price survey. Visit the leading local grocer, the closest mass merchant (such as Walmart or Dollar General), and the nearest QSR drive-thru. Record shelf prices on your top 20 high-velocity SKUs, including milk, sandwich bread, eggs, 20-ounce soft drinks, core energy drinks, and top tobacco items.
- Days 3 to 4: Adjust base KVI pricing. Reset prices on those 20 items to land within a 2% to 5% window of local discounters. Update point-of-sale files and print fresh, high-contrast shelf tags.
- Days 5 to 7: Rebalance margin harvesting. Identify 40 to 60 low-velocity, price-inelastic SKUs in health and beauty, automotive maintenance, and specialty snacks. Adjust retail prices up 3% to 6% to offset the KVI changes and protect total store penny profit.
The goal this week is to neutralize any price-gouging perception while keeping gross profit dollars balanced.
Week 2: Foodservice Bundling and Dispensed Beverage Reconfiguration
Week two centers on your highest-margin profit engine: prepared food and dispensed beverages.
- Days 8 to 10: Engineer two core bundles. Create a $4 Breakfast Deal (breakfast sandwich, hash brown, and hot coffee) and a $5 Lunch Deal (hot entree, chips, and a 32-ounce fountain drink). Calculate recipe costs so blended COGS stays at or below 30%.
- Days 11 to 12: Reorganize the beverage island. Clear out obsolete packaging and add stainless-steel syrup organizer rails and flavor pump stations next to the ice and fountain dispenser. Post clean, laminated counter graphics featuring two signature recipes.
- Days 13 to 14: Train front-line staff. Walk each team through the new bundles. Coach cashiers to suggest beverage upgrades and meal add-ons at checkout in a helpful, low-pressure way.
The goal this week is to capture lunch visits from fast-food defectors and lift blended food margins toward 70%.
Week 3: Store Environment and Forecourt Conversion
Week three follows the physical customer journey, from the fuel dispenser through the front door to the register.
- Days 15 to 17: Exterior and forecourt audit. Power-wash the concrete around fuel pads, clean dispenser touchpads, and repaint worn curb striping. Remove faded paper signs from dispenser housings. If your pumps have digital screens, program slides featuring the $4 breakfast and $5 lunch bundles.
- Days 18 to 19: Clear the window sightlines. Take tape-mounted promotions and vendor posters off entrance doors and storefront glass, so there is a clear view from the pumps to your beverage counter and fresh food case.
- Days 20 to 21: Reset two endcaps near checkout. The first should feature your Good-Better-Best private-label snack line beside national brands. The second should be a “Protein and Energy” display with jerky, meat sticks, protein bars, and ready-to-drink protein beverages.
The goal this week is a 5% to 10% lift in pump-to-store conversion.
Week 4: Community Goodwill, Sourcing, and Digital Rollout
The final week roots your value strategy in authentic local connection.
- Days 22 to 24: Launch a register round-up. Following regional operators such as Parker’s Kitchen, configure your point-of-sale system to offer a simple round-up donation. Choose a respected local cause, such as a food bank, youth sports league, or first responders. Consider matching a share of the round-up pennies, for example 25%, up to a fixed monthly cap. Post clear signage showing the contributions.
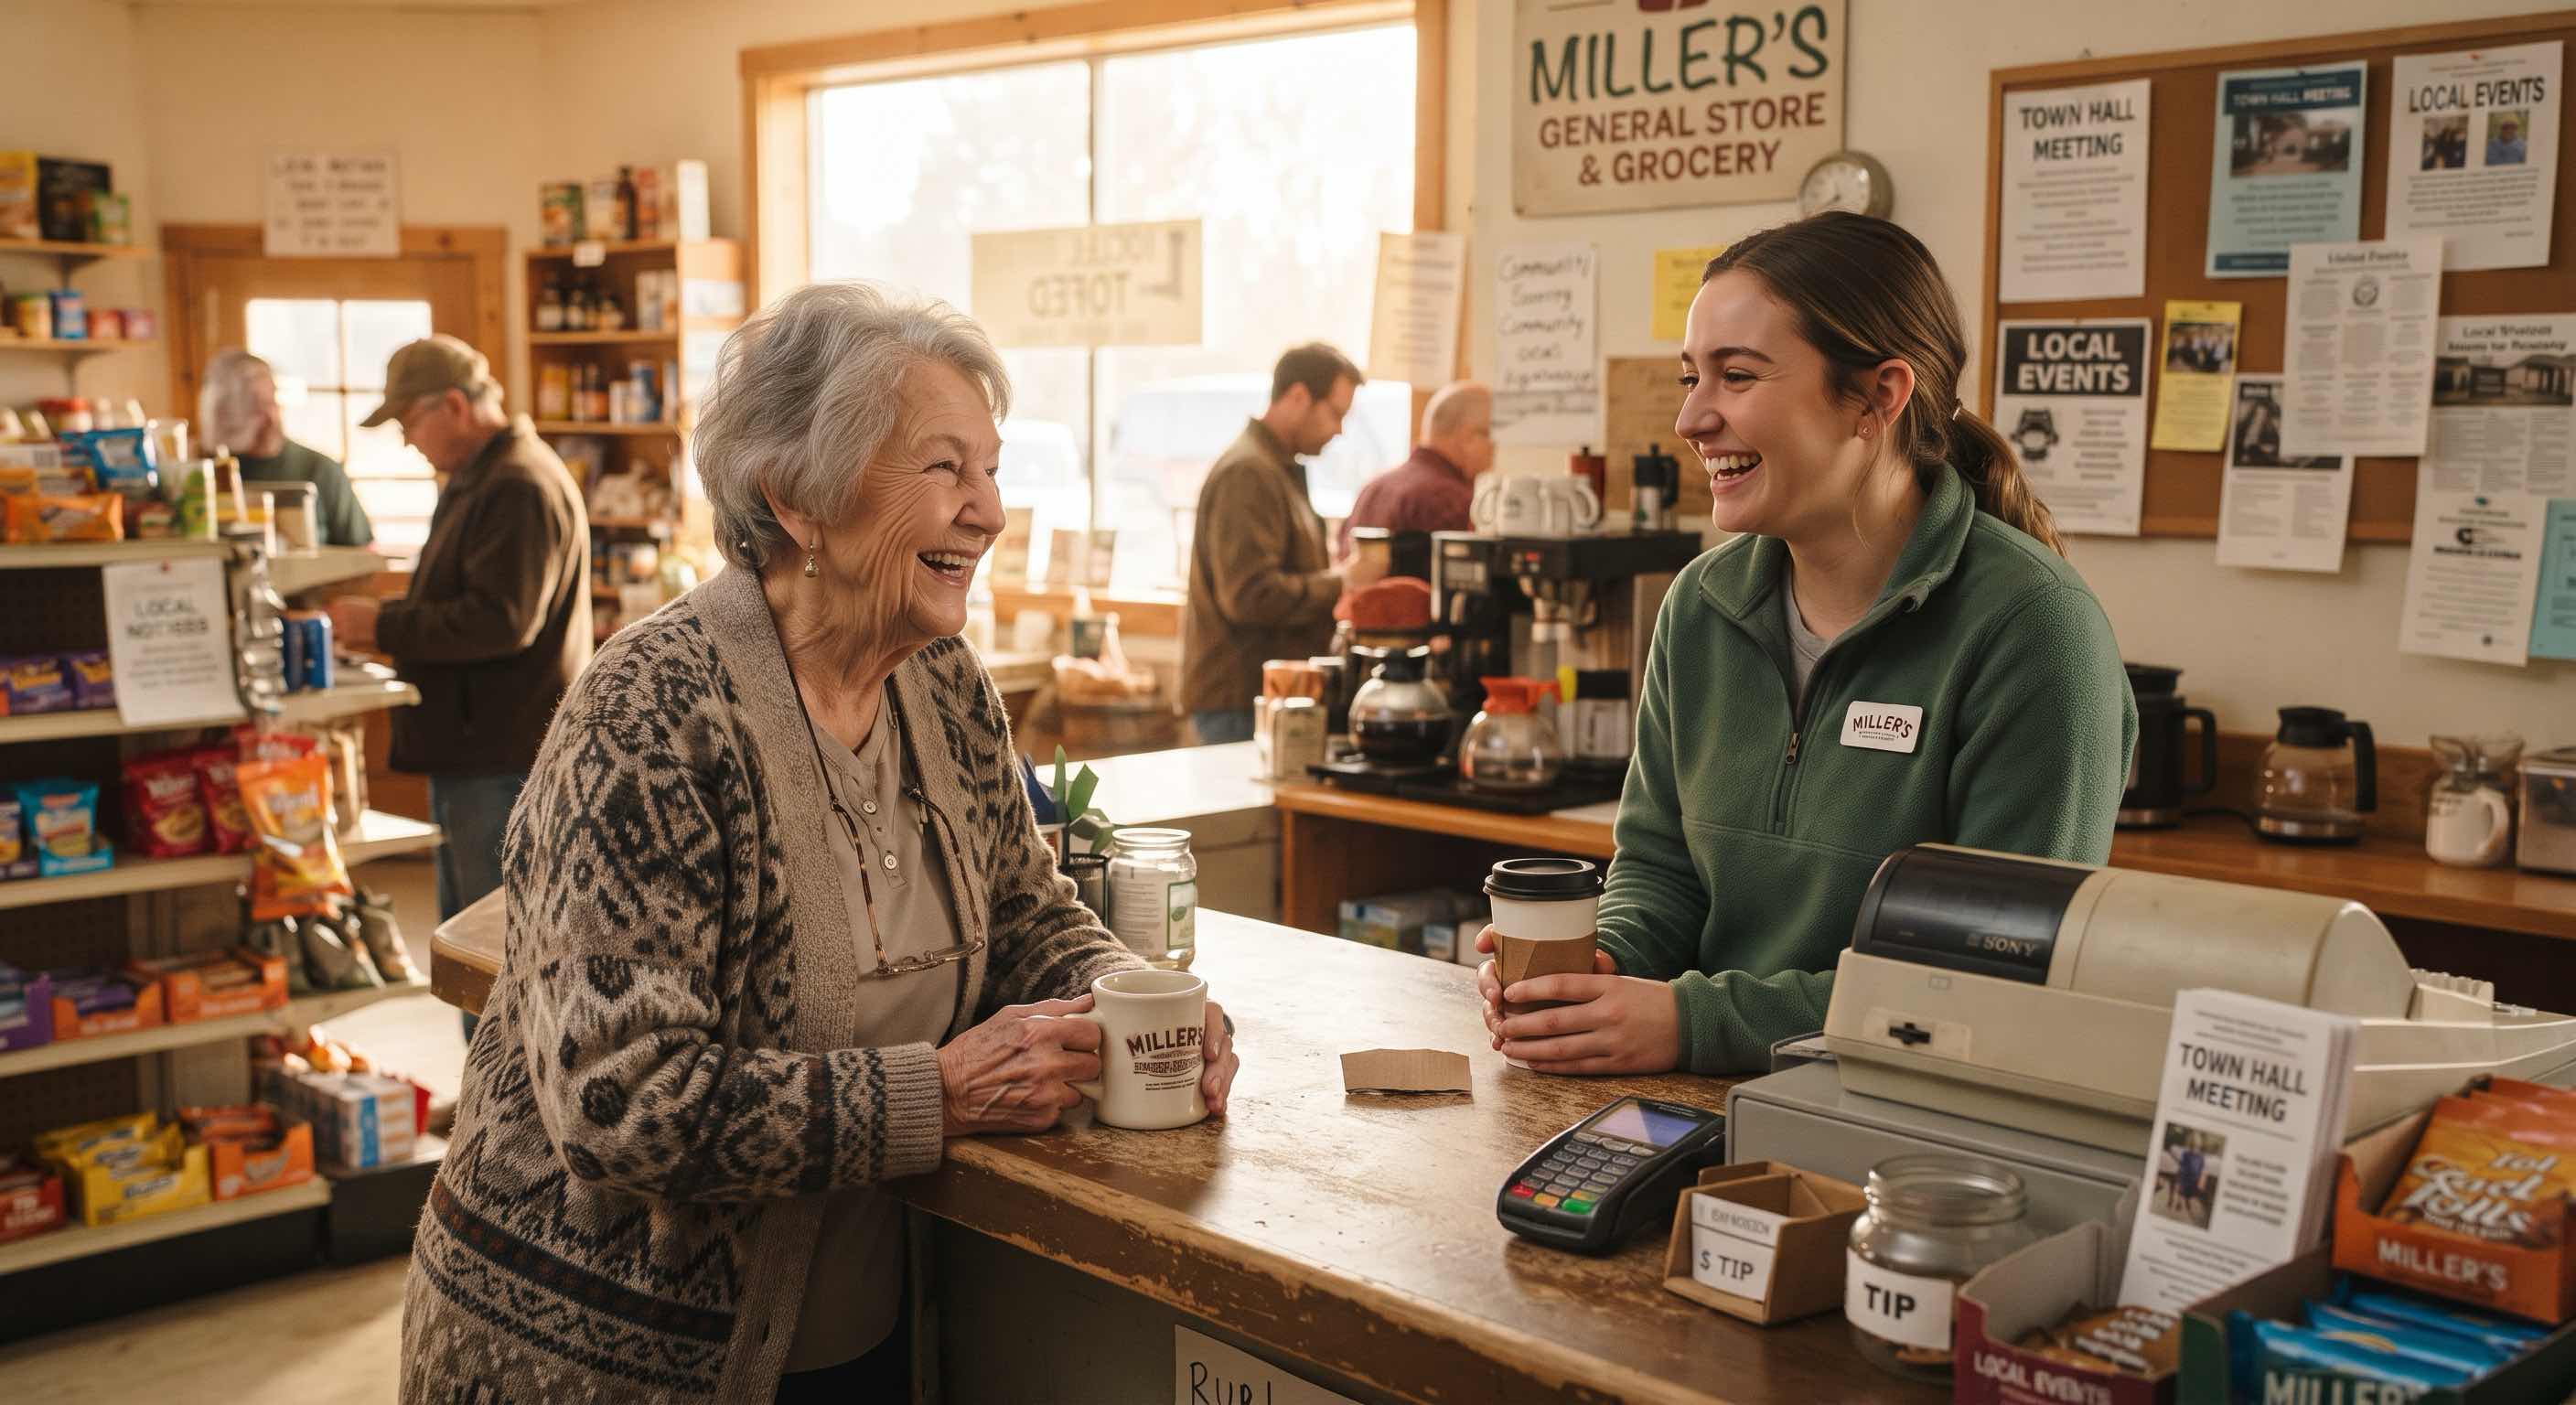
- Days 25 to 27: Highlight hyperlocal sourcing. Following the model of leaders like Kwik Trip, partner with an independent regional dairy or nearby bakery for fresh milk or morning baked goods. Add clean, framed signs naming the regional partners. Local sourcing supports both quality perception and price credibility.
- Days 28 to 30: Digital and local marketing push. Update your social channels and loyalty app to highlight the new pricing and bundles. Send an app notification about the $5 lunch bundle and fuel rewards. Review 30-day point-of-sale reports to confirm inside gross margin dollars are trending upward.
The goal this week is to build long-term goodwill and recurring weekly visits.
What You Should Be Doing: Execute the 30-Day Turnaround
- Assign one accountable lead. Name a store manager or category director to own each weekly milestone and track completion on a printed checklist in the back office.
- Hold a Monday velocity and margin review. Pull basket size, inside gross margin dollars, and pump conversion rates every week. Adjust secondary item pricing if KVI volume moves faster than expected.
- Make community contributions visible. Display check presentations, photo boards, and social posts. Authentic local goodwill builds loyalty that competitors cannot easily copy.
The Bottom Line: Turn Every Fueling Driver into a Loyal Inside Customer
Managing price perception during a period of consumer financial strain does not mean sacrificing profitability. It does not mean racing to the bottom against big-box hypermarkets or selling center-store products below cost. It means intentional store design, structured pricing, and operational discipline.
As we move through late 2026, the operators who thrive will be those who accept that the unearned convenience premium has run its course. Here is what the four pillars add up to.
The Foundational Landscape showed why shoppers are guarded. Cumulative inflation has pushed them into a flight to value where saving money outweighs quality five to one. Align your core KVIs with local market leaders, balance the margin with price-inelastic categories, and manage by penny profit instead of percentage. That removes hesitation at the front door.
Strategic and Operational Execution turned theory into practice. A Good-Better-Best private-label structure gives budget-conscious shoppers real relief while earning you more cash profit per unit. Clean casework, open sightlines, bright lighting, and a clear front window make your prices feel fair before anyone reads a tag. Dynamic pump screens, geofenced offers, and fast checkout help bring fuel customers inside.
Innovation and Profit Maximization showed where to differentiate. Fresh, customizable foodservice with $4 and $5 bundles, anchored by high-margin dispensed beverages, puts you in direct competition with fast-food drive-thrus on speed, quality, and price. Flavor stations, protein-forward endcaps, and app-based loyalty meet younger and health-conscious shoppers where they are.
The Executive Action Plan gave you the sequence. In 30 days you can realign pricing, launch your meal bundles, clean up the store and forecourt, and build visible community goodwill.
Price perception is not just an accounting equation. It is also a visual and sensory experience, and every part of your store contributes to it, from the shelf tag to the countertop to the front glass. When a store looks clean, organized, and invested in its neighborhood, customers conclude that the prices are fair and the food is dependable.
You already have the three advantages that matter most: proximity, speed, and neighborhood relationships. What many stores need now is the discipline to make value visible.
So do not wait for the broader economy to improve. Put on your walking shoes today, head out to your forecourt, and stand by pump six. Look back at your store through the eyes of a budget-conscious customer.
Then take the first step. Check the price of your gallon of milk against the grocery store down the road. Clear your window glass. Review your lunch combos. Start working through Week 1 of the roadmap, and let each small win build momentum for the next one.

Leave a Reply